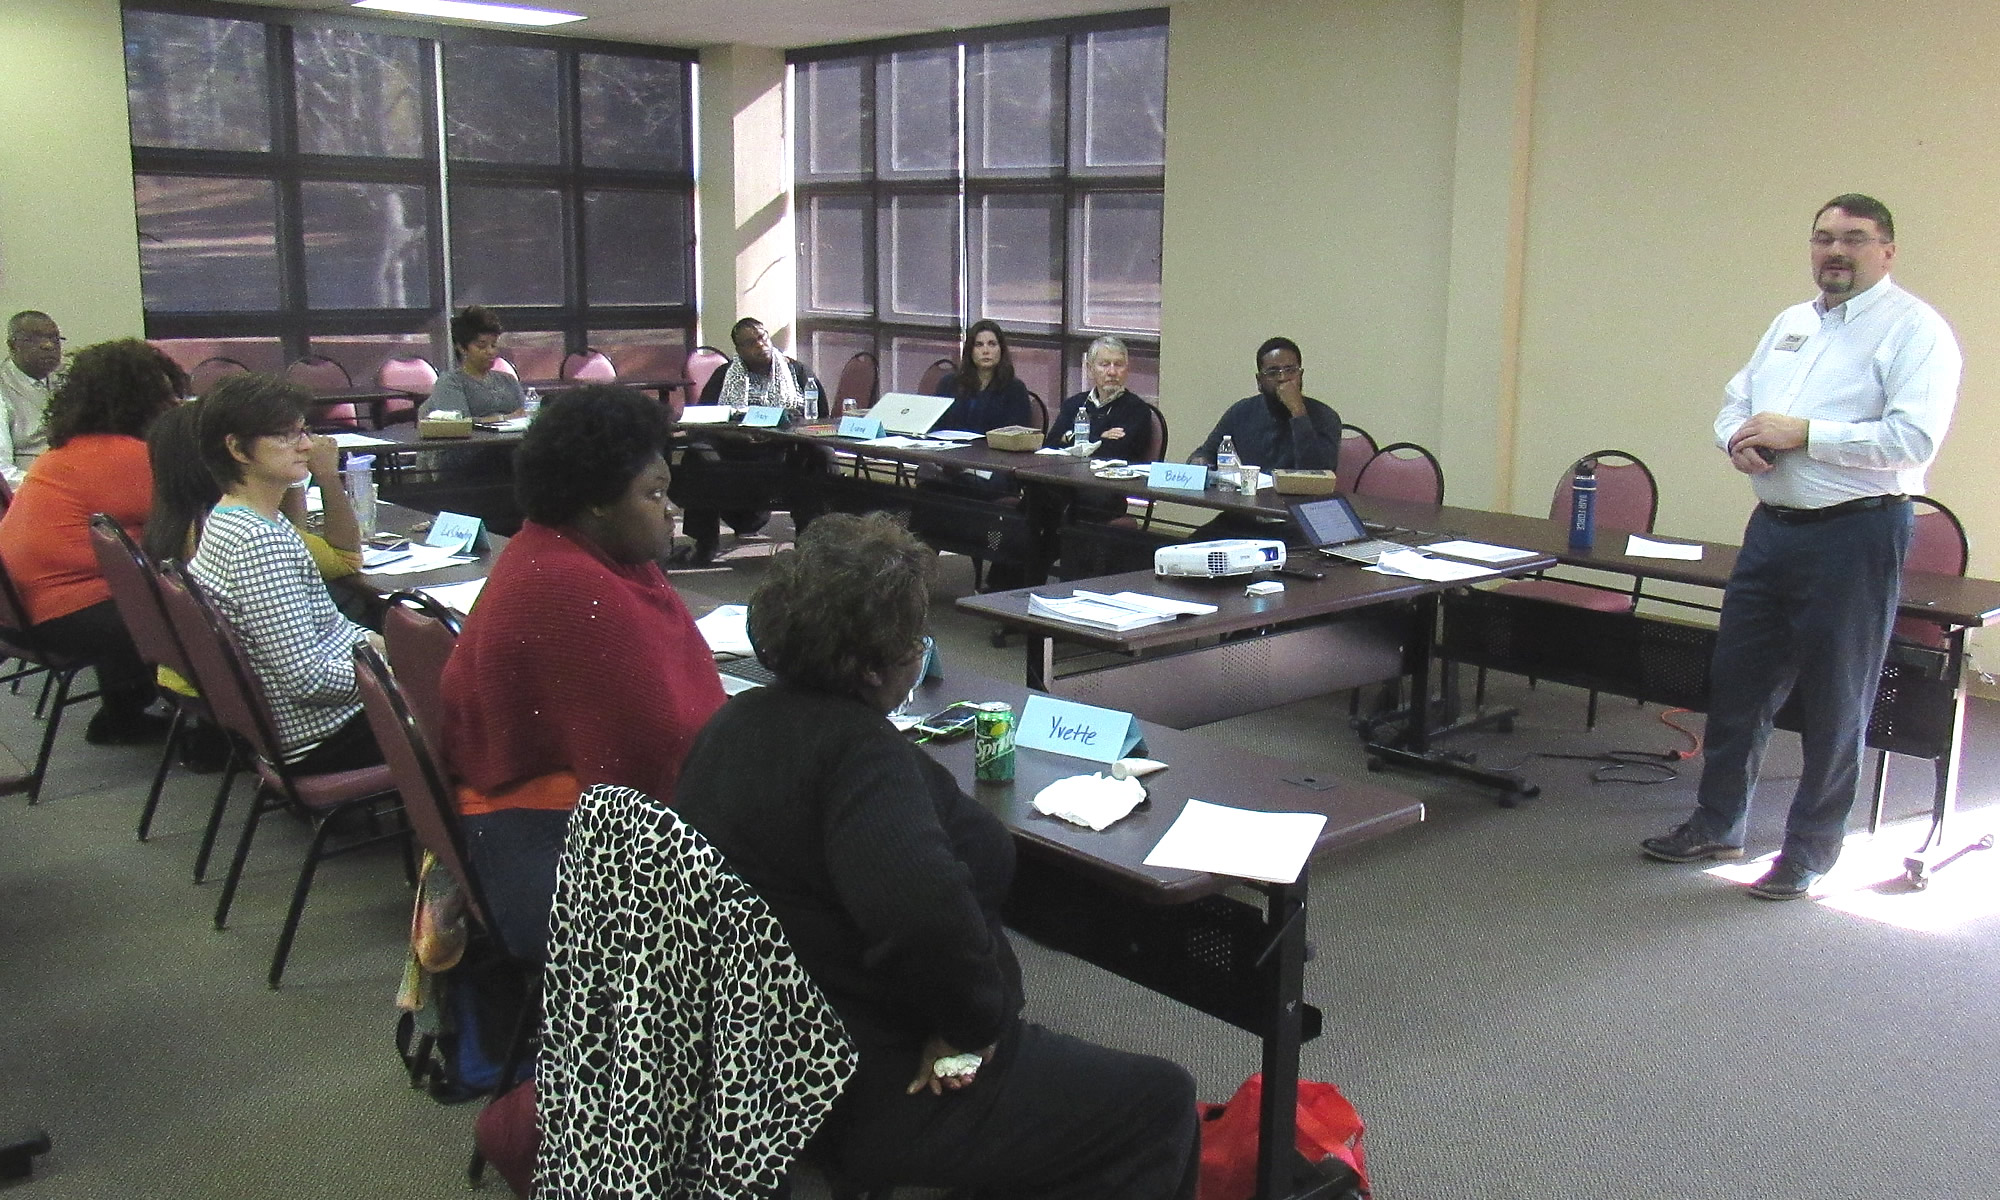
From February to June 2017, the Center for a Better South facilitated seven training sessions in the challenged counties of the S.C. Promise Zone in the lower part of South Carolina. From lasses on writing compelling grants to full-day sessions to help community leaders understand asset-based community development, the Center trained more than 10 dozen people from Walterboro and Early Branch to Allendale and Blackville thanks in large part to a grant from the U.S. Department of Agriculture. More trainings are planned.
Center provides more leadership in Promise Zone
MARCH 2016 | A newly-released strategic plan that provides long-term guidance for the S.C. Lowcountry Promise Zone received major input from the Center for a Better South, including production of a four-minute video about the project.
The plan, released earlier this month after town halls, meetings and strategy sessions involving 1,000 people, organizes efforts to reduce poverty in the southern tip of South Carolina through strategic efforts of eight workgroups, each of which has specific goals and all of which seek to achieve transformational goals by working together. Continue reading “Center provides more leadership in Promise Zone”
A five-year retrospective (2011)
In this 2011 video, we share some of our successes from our founding in 2005 through 2010, when we worked on a project for the Secretary of Navy following the Deepwater Horizon disaster in the Gulf of Mexico.
The video highlights how the Center for a Better South is a pragmatic think tank for thinking Southern leaders who want to make a difference. Learn about our Agenda, our annual policy conference, our 2010 report on the Gulf and more.
Meet the Center (2008)
Here’s a video we first highlighted in 2008 that outlines the mission of the Center for a Better South. Learn about the exciting research projects that have been published and are on tap by the Center for a Better South, a regional nonprofit to provide policy information for thinking Southern leaders. The video includes clips from Center founders Andy Brack, Leo Fishman and John Simpkins.
Video: Promoting opportunity (2013)
You can click the image below to see a four-minute video from 2013 that the Southern Crescent, an impoverished area that stretches from Virginia through South Carolina and then swings over to the Mississippi Delta.
It highlights a dozen maps of the area — maps that tell quite a story.
- Let us know what you think. (Video added 10/3/2013).
SOURCES
Here are the sources for the maps that appear in the October 2013 video for the Southern Crescent project:
- POVERTY: Percentage of adults 18-64 living in poverty, ACS, five-year average, 2010, Census.
- POPULATION, white: Total population, white, Census 2010.
- POPULATION, black: Total population, Black or African American alone, Census 2010.
- HOUSEHOLDS: Family households, female householders, no husband present, Census 2010.
- HOUSEHOLD INCOME: Median household income, ACS 2010, 5 year estimate, Census.
- LOW INCOME: Household income, less than $10,000, ACS 2006-2010, Census.
- EDUCATION: Population 25 and over with less than a high school education, ACS 2006-10, Census.
- SLAVERY: Slave population, 1860 Census.
- UNEMPLOYMENT: Unemployment rates by county, August 2012 to July 2013 averages, U.S. Bureau of Labor Statistics.
- ELECTION: 2012 presidential election results, by county. Article and map via Wikipedia.
- HEART DISEASE: Death rate per 100,000 people, age 35+, all race, all gender, 2008-10, National Vital Statistics System, National Center for Health Statistics, Centers for Disease Control. Online: http://nccd.cdc.gov/DHDSPAtlas/viewer.aspx
- DIABETES: Age-adjusted estimates of the percentage of adults with diagnosed diabetes, 2010. Centers for Disease Control and Prevention: National Diabetes Surveillance System. Available online at: http://apps.nccd.cdc.gov/DDTSTRS/default.aspx. Retrieved 9/18/2013.
- OBESITY: Age-adjusted estimates of the percentage of adults who are obese, 2008 data, Centers for Disease Control. Map via MaxMasnick.com.
- CHLAMYDIA: Chlamydia–Rates by county, United States, 2010. Centers for Disease Control and Prevention, National Center for HIV/AIDS, Viral Hepatitis, STD, and TB Prevention, Division of STD Prevention. Online at: http://www.cdc.gov/std/stats10/figures/4.htm


